Before you begin, make sure you've set up a Reporting Connector. To learn how, click here.
Connecting Power BI to a Reporting Connector is similar to connecting Excel. The main difference is that Power Query in Power BI will generate most transformation steps automatically. We will go through the steps and highlight the key differences.
Let's get started.
Columns query
First, create a Columns query.
-
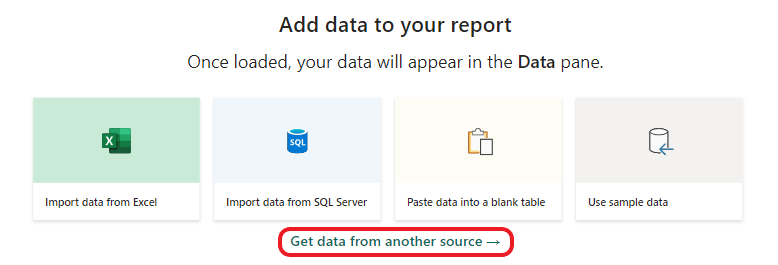
Open Power BI Desktop and start with a Blank report. Select Get data from another source.
-
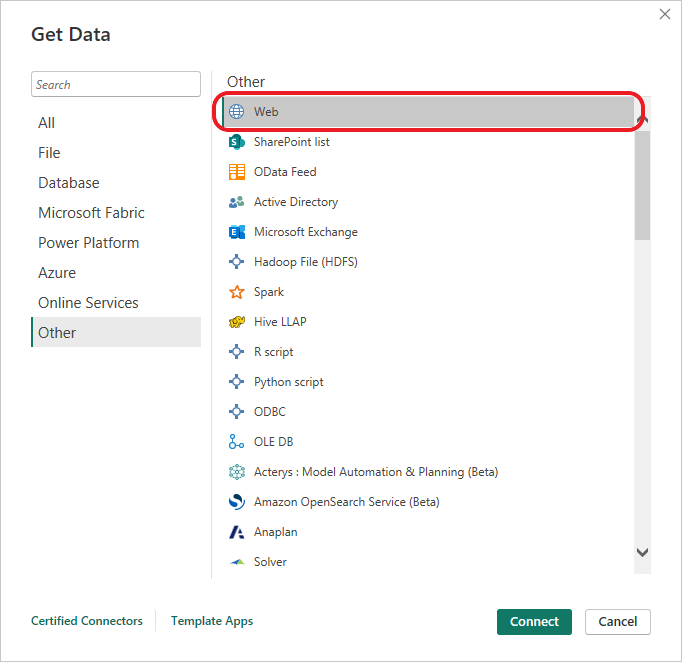
In the Get Data dialog, select Other > Web, then hit Connect.
-
In the dialog, enter the Columns URL from the connector details into the URL parts field. In the HTTP request header parameters fields, set the first value to 'Authorization' and the second value to the Authorization Key from the connector details:
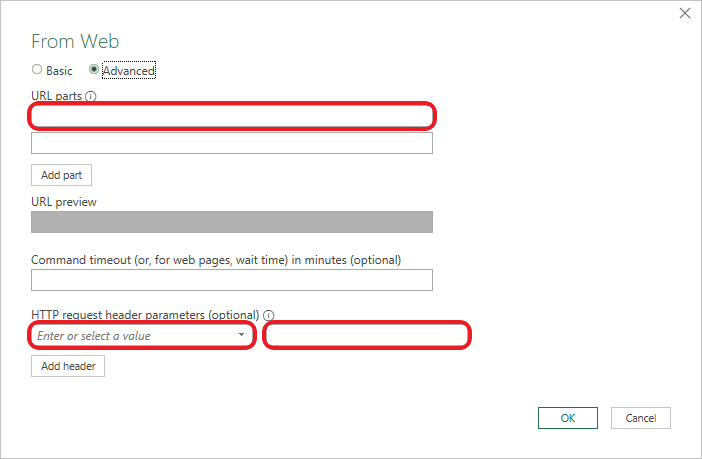
Click OK when you're done. -
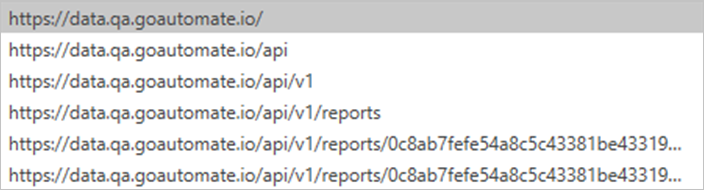
The next dialog box asks how to apply the Authorization Key you entered earlier. Each Columns URL has its own Authorization Key for security. In the field Select which level to apply these settings to, select the last item, which ends with 'data'.
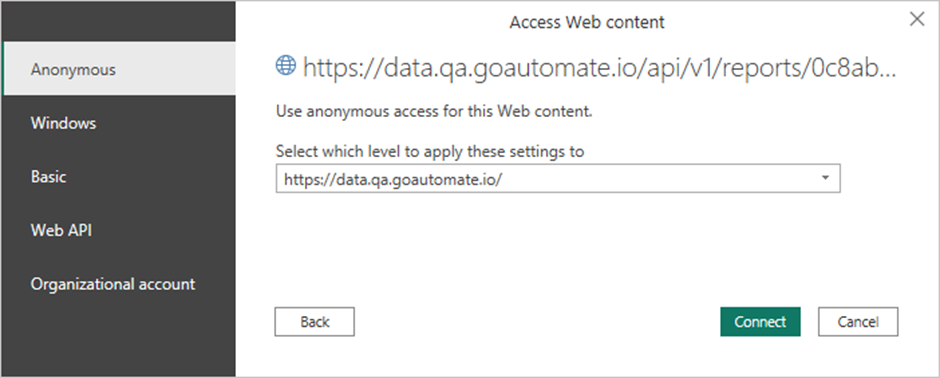
Click Connect when you're done. The Microsoft Power Query Editor will open. -
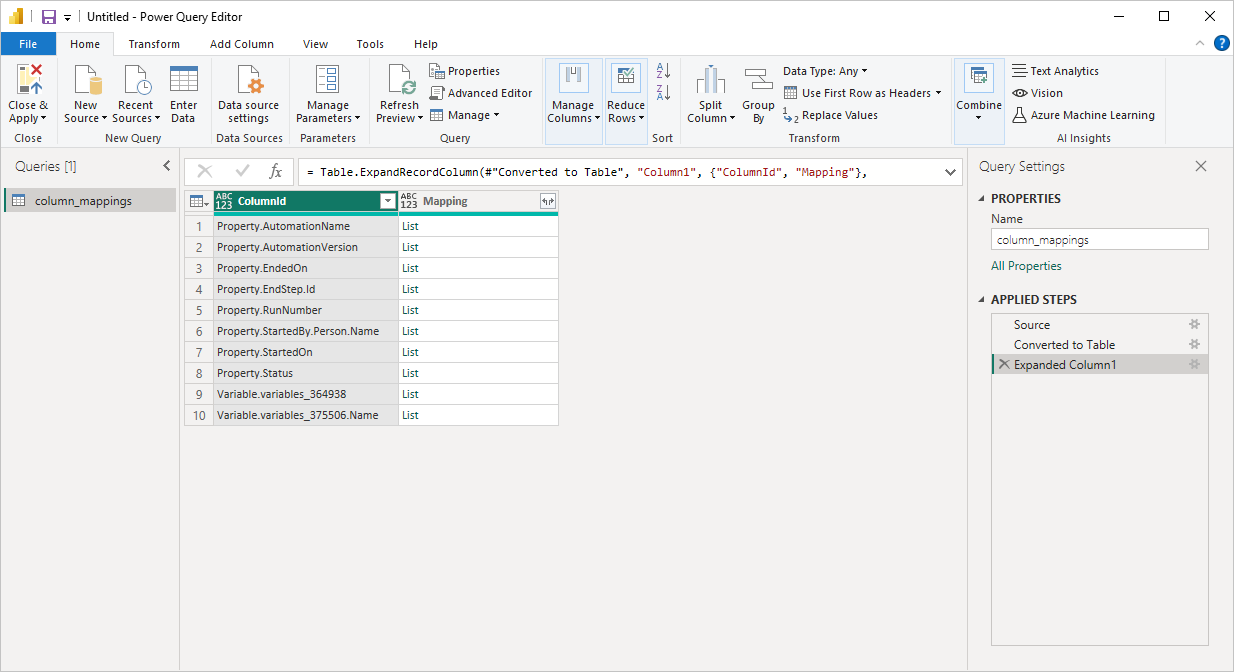
In the APPLIED STEPS panel, delete Steps Changed Type and Split Column.

-
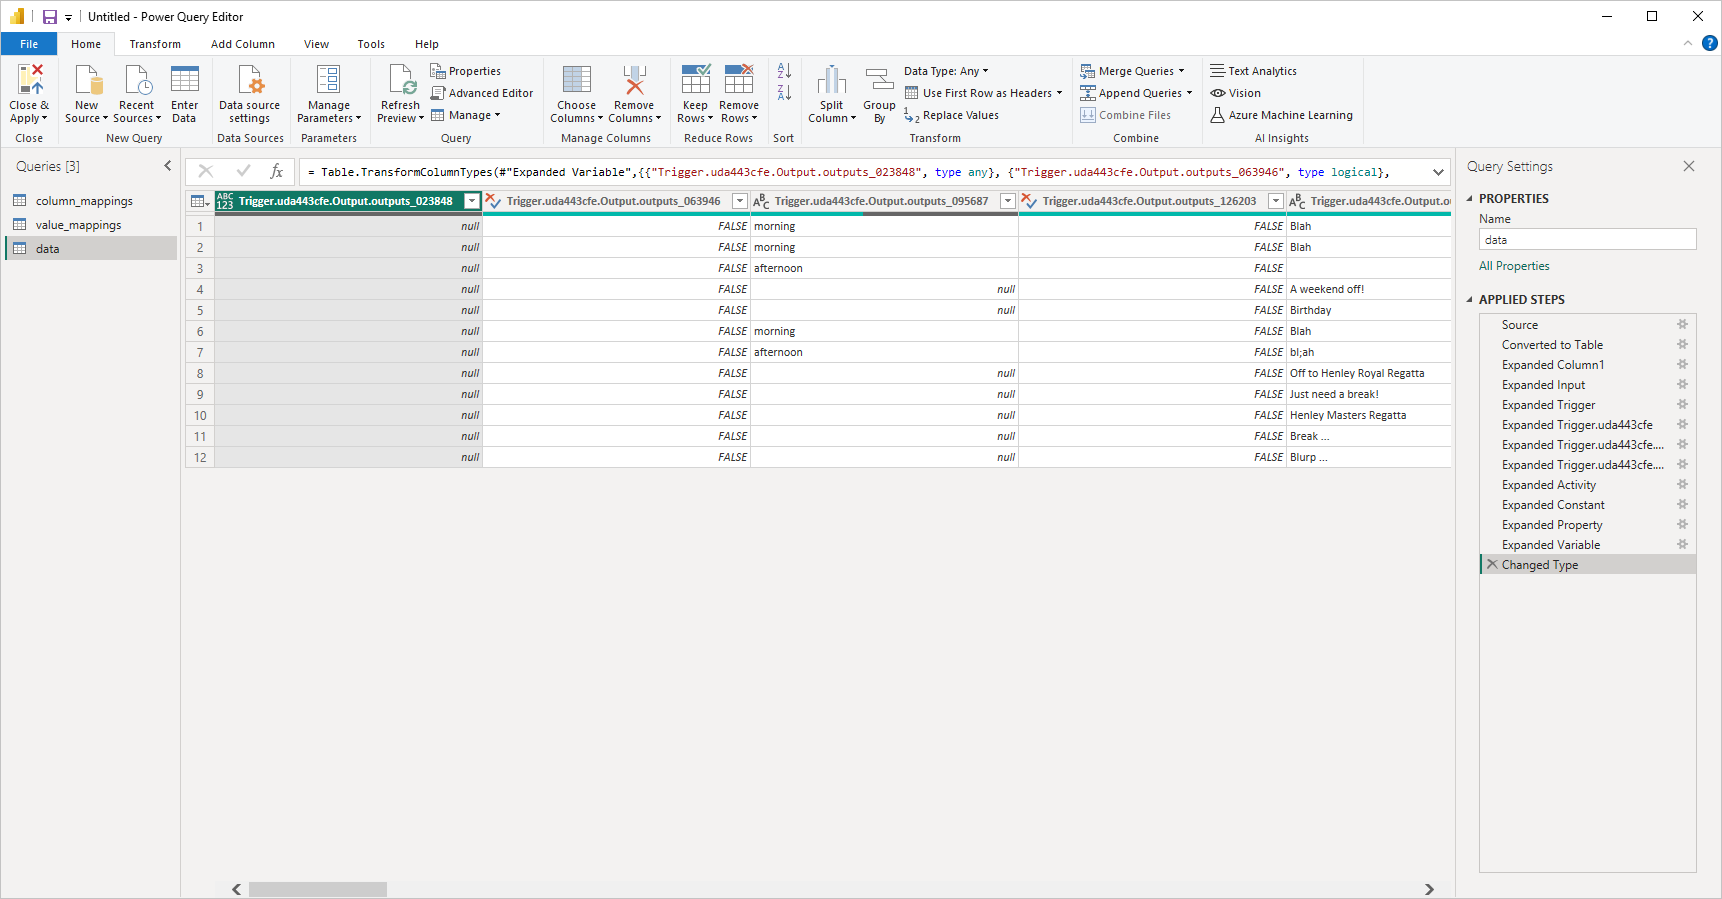
Your Power Query Editor should look like this. The contents of your table might be a bit different, but that's fine.
Values query
Since the End and Trigger steps are identified by an ID instead of a name (to prevent breaking reports if you rename these steps in your automation), you can identify these steps in your report by creating a Values query.
You only need to do this if you need to name an End or a Trigger step in your report or data extract.
Let's create a Values query.
-
In Power Query Editor, right-click the empty space in the Queries panel.
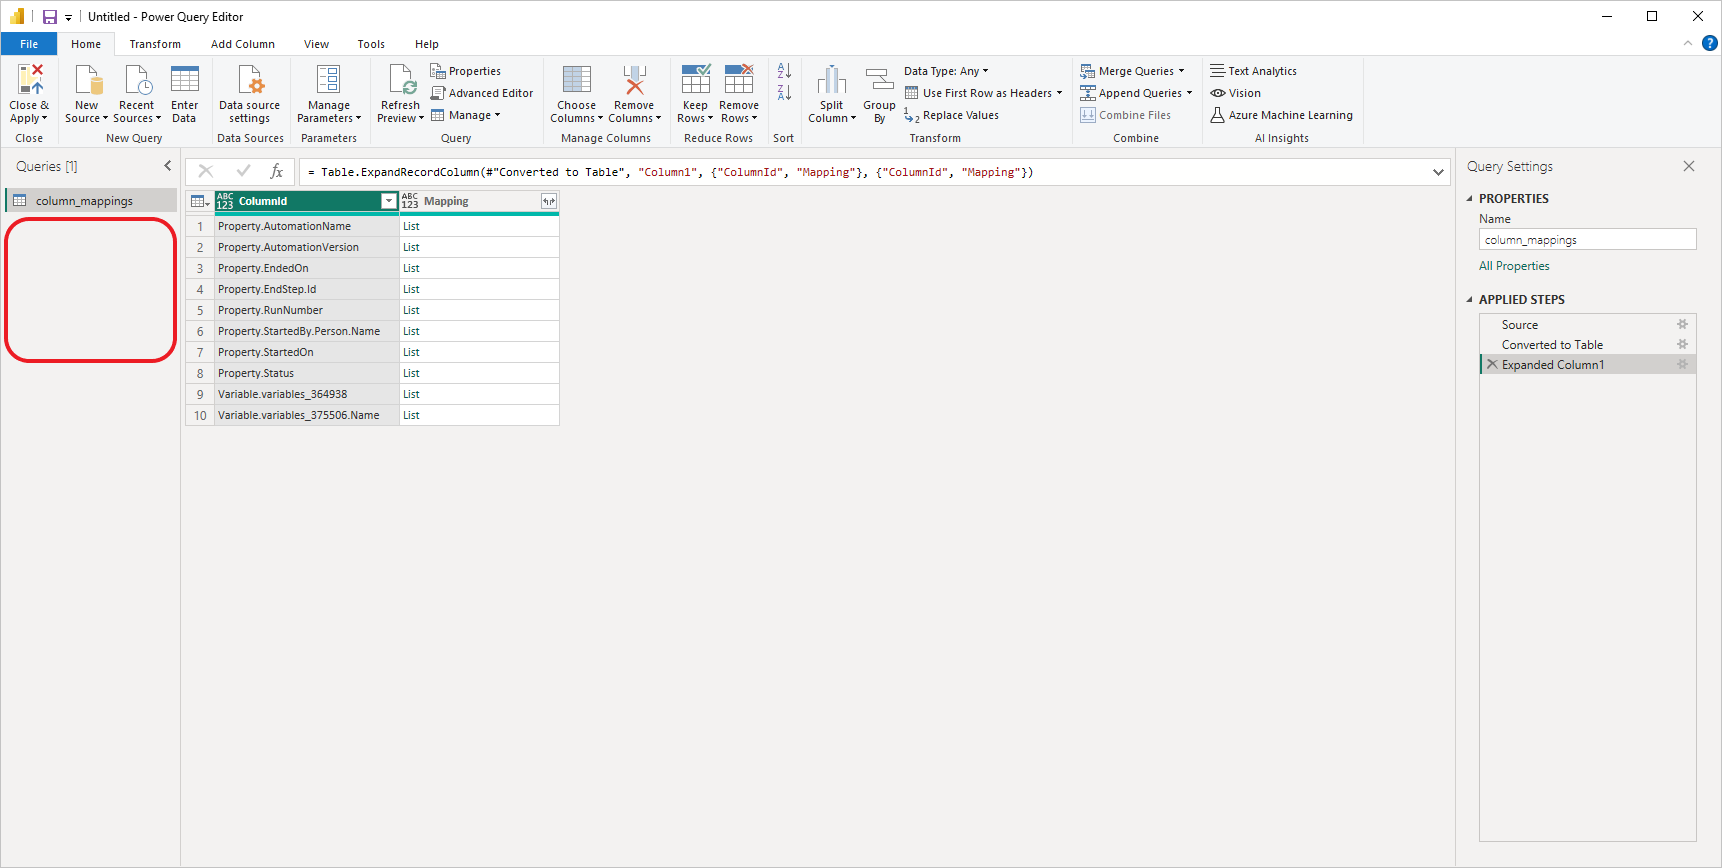
From the menu, select New Query > Other Sources > Web. -
In the dialog, enter the Values URL from the connector details into the URL parts field. In the HTTP request header parameters fields, set the first value to 'Authorization' and the second value to the Authorization Key from the connector details:
Click OK when you're done. -
The next dialog box asks how to apply the Authorization Key you entered earlier. Each Values URL has its own Authorization Key for security. In the field Select which level to apply these settings to, select the last item, which ends with 'data'.
Click Connect when you're done. -
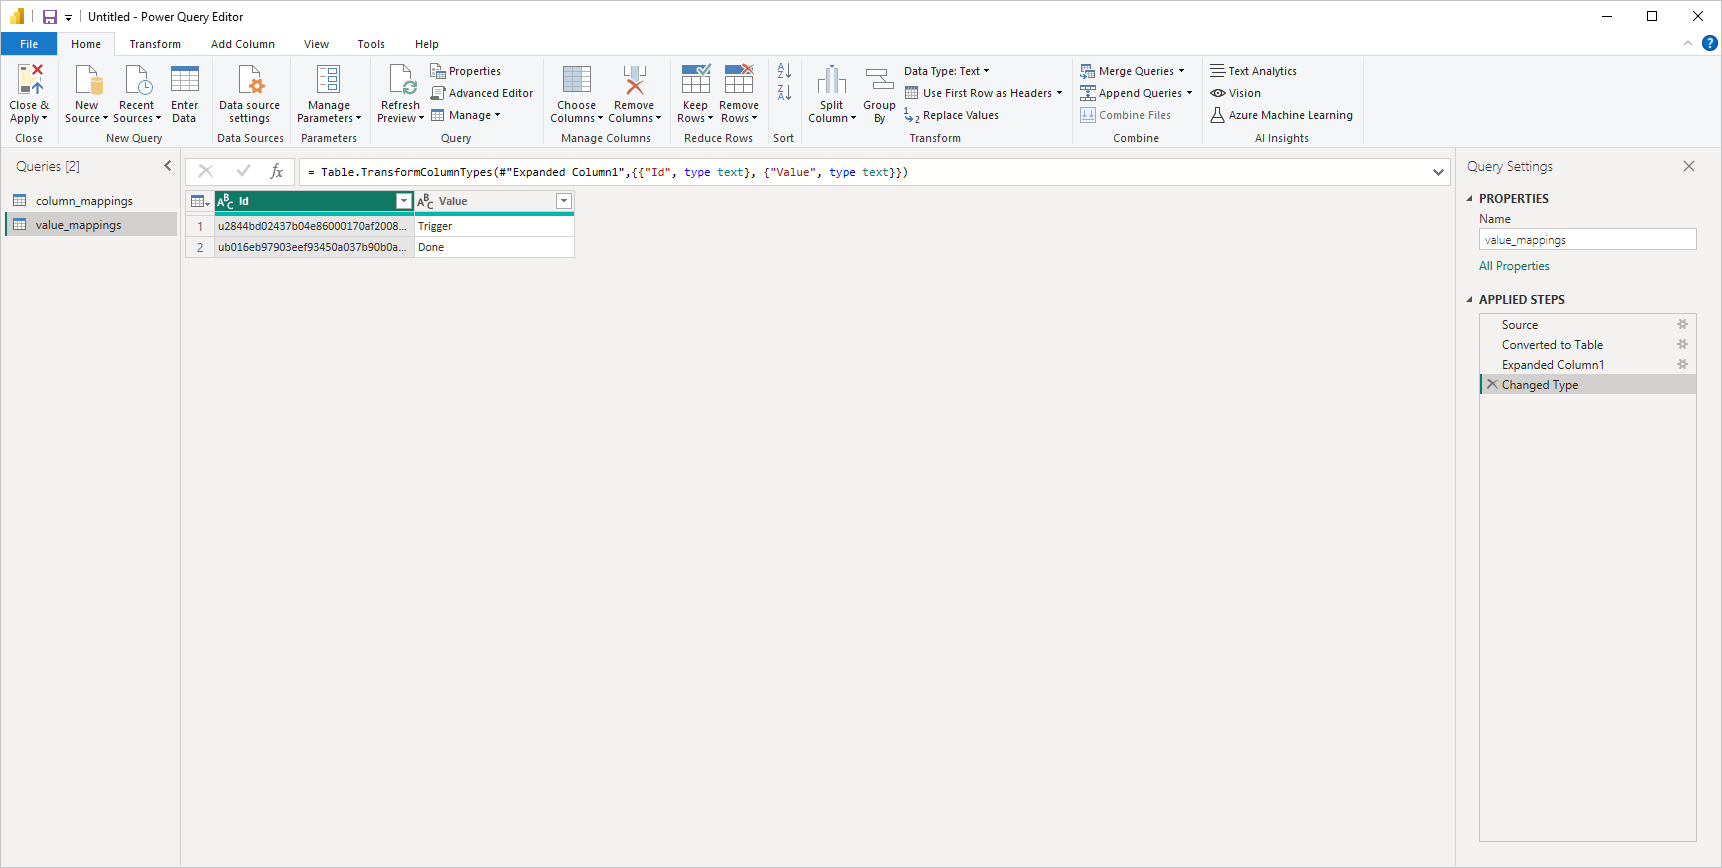
Your Power Query Editor should look like this. The contents of your table might be a bit different, but that's fine.
Data query
Finally, let's create the Data query to retrieve all the data from the automation.
If you added the Values query, you will see it in the Queries panel along with the columns query (below).
-
In Power Query Editor, right-click the empty space in the Queries panel.
From the menu, select New Query > Other Sources > Web. -
In the dialog, enter the Data URL from the connector details into the URL parts field. In the HTTP request header parameters fields, set the first value to 'Authorization' and the second value to the Authorization Key from the connector details:
Click OK when you're done. -
The next dialog box asks how to apply the Authorization Key you entered earlier. Each Data URL has its own Authorization Key for security. In the field Select which level to apply these settings to, select the last item, which ends with 'data'.
Click Connect when you're done. -
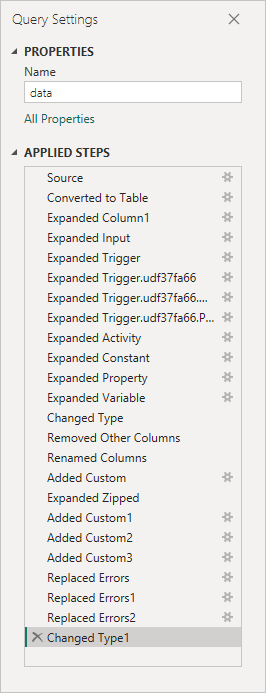
Your Power Query Editor should look like this. The contents of your table might be a bit different, but that's fine.
Removing unnecessary columns
We have a data query that gets data from our automation and a columns query to choose which data to show in our Power BI report or dashboard. To remove unnecessary columns using the columns query, follow the instructions in Removing Unnecessary Columns in Connecting with Excel.
Now, you can easily choose which columns to include in your Power BI report or dashboard without changing Power Query. Just add or remove Labels in the Column Mappings, and the columns will automatically update when you refresh your query in Power BI.
Making column names easier to read
Our columns query also lets us automatically manage column names. To automatically manage column names using the columns query, follow the instructions in Making Column Names Easier to Read in Connecting with Excel.
Now, you can easily rename your columns without changing Power Query. Just update the Labels in the Column Mappings, and the columns names will automatically update when you refresh your query in Power BI.
Renaming trigger and end ids to names
If you have multiple Trigger steps and want to know which one started your automation, or if you want to know which End step was reached, use Value Mappings. The values query lets you convert the ID of the Trigger or End into a name you choose. To convert the ID of Trigger or End steps using the values query, follow the instructions in Renaming Trigger and End IDs to Names in Connecting with Excel.
Now, you can easily name your Trigger steps and End steps without changing Power Query. Just update the Labels in the Value Mappings, and the values will automatically update when you refresh your query in Power BI.
Advanced topics
Let's explore some advanced techniques. This includes working with arrays of values, groups of arrays, and special handling for multiple completions of Activities.
Arrays
Arrays of values are displayed as List in the value column of the row. You have two main options:
- Join all values with a comma or similar separator to form a single value Extract values.
- Duplicate the row, with each row showing one value from the array Expand to New Rows.
Let's explore both options:
Extract values
Extract Values is a Power Query step that combines multiple values from an array into one value, separated by a comma or other separator. Here's how it works:
-
In Power Query, click the expansion icon on the column with the List, then choose Extract Values... from the menu.

-
In the drop-down menu, select a delimiter to separate values, then click 'OK'.

-
The cell contents have changed from a List to a value for each item in the array, separated by your chosen delimiter.

This is the simplest way to convert an array of values into a single string separated by a delimiter. However, it has some limitations, such as not being able to change the data type or modify the format in Power Query because the result is treated as 'Text'.
Expand to new rows
Expand to New Rows is a Power Query step that creates new rows from an original row. Each new row has the same column values, but the array is split so that each new row contains one item from the original array. Here's how it works:
-
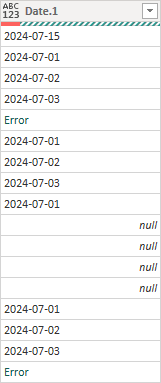
In Power Query, click the expansion icon on the column with the List, then choose Expand to New Rows from the menu.
-
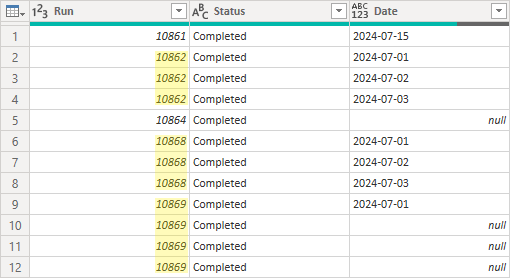
The cells used to show a List but now display a single value for each item in the array. The number of rows has gone up. For example, Run 10862 used to have one row but now has three rows because its Date array had three items. Similarly, Run 10868 also has three rows now. Run 10869 has four rows because its Date array had four items, even though three of them were null.
This method may create duplicate rows, but it allows you to control the data type and format of columns.
Group arrays
We saw above that individual arrays can either have all items joined together to form a single item, or expanded, in which case rows are duplicated.
Sometimes multiple arrays are grouped together. In these cases, all arrays have the same number of items, and corresponding items across arrays are related. This requires a different approach than just extracting or expanding individual arrays.
Here's how we apply handle groups of arrays by using 'zipping' in Power Query:
-
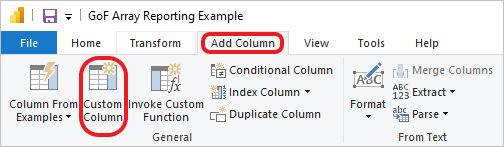
In Power Query, click the Add Column tab and then Custom Column.
-
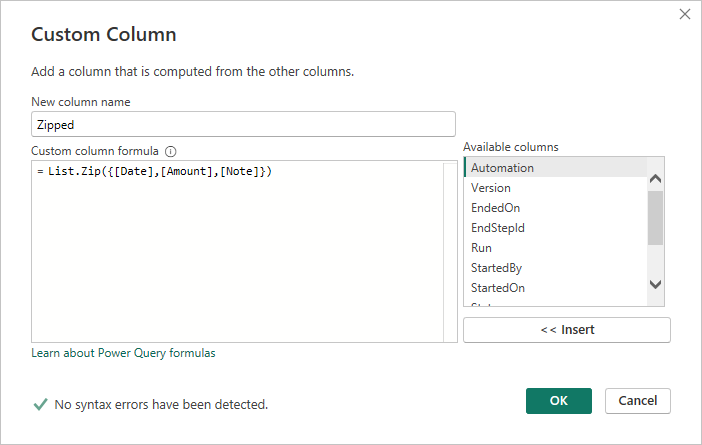
In the Custom Column dialog, for the New column name, enter the name
Zipped.
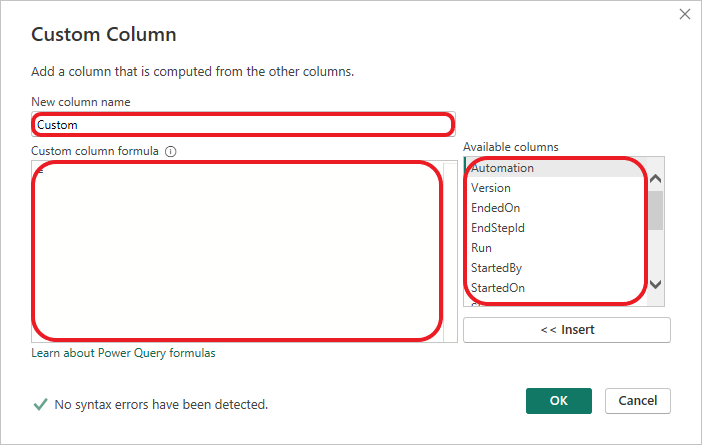
For the Custom column formula, entereach List.Zip({ }). Position the cursor between the curly brackets and then select columns from the Available columns, making sure you include a comma between each selected column.
Pay attention to the use of brackets. The List.Zip function uses regular brackets:List.Zip(). Inside these, it uses curly brackets:each List.Zip({ }). Within the curly brackets, each column is enclosed in square brackets and separated by commas. -
Your Custom Column dialog should look similar to this, depending on the columns you selected.
Click OK when finished. -
On your newly created Zipped column, click the expansion button and select Expand to New Rows.

This will create additional rows. -
The final step is to extract items from the expanded Zipped column. Repeat this step for each array you 'Zipped' together in the previous step. Now, create a new Custom Column.
For the New column name, enter the name of the first column you 'Zipped'. In our example, this isDate. This will create a duplicate column name, so Power Query will add '.1' to the end. You can change the column name later if needed.
In the Custom column formula, enter[Zipped]{0}. The zero represents the first item in the 'Zipped' array, which is our Date column.
Click OK when finished.
Repeat this step for the other columns you 'Zipped', increasing the number inside the curly brackets[Zipped]{0}for each column.
That's it! We've successfully combined the group arrays. You can now remove the original columns, like Date, and rename the suffixed columns, like changing Date.1 to Date, if you want.
Multiple completions
For Teams Activities where more than one person needs to complete an Activity, all outputs and some of the step properties are turned into arrays. This means you'll handle multiple values instead of single ones.
You can use methods covered in this section, like extracting, expanding, or grouping, depending on what you need from the data.
Files
This section explains how to access files that were collected during an automation run using Excel and Power BI.
This section isn’t ready just yet—we’re working on it! Please check back soon, and if you need help right away, feel free to ask in our Community Forum.
Cell-level errors
When adding custom columns, you might see errors in some cells. The column header will have a red marker, and some cells will say 'Error,' as shown below. These errors won't stop the query or usually affect your data. However, you can clean them up by right-clicking the column with the error marker and selecting Replace Errors.... Then, choose a value to replace the errors with, usually null, which means the cell is empty.
Learn more from Microsoft about 'Cell-level errors' here
Changing column data types
When you run a query and fetch data from the Reporting Connector, Power Query assigns a default data type to each column. You may need to change these defaults. For example, set 'Amount' to 'Currency' or apply a location-specific format for dates. To change a column's data type, right-click the column, select Change Type, and choose the appropriate type. Doing all data type changes in one step minimizes the number of steps, making maintenance easier.
Learn more from Microsoft about 'Data types' here
Data Query URL Parameters
This section explains how to use URL query parameters to control the data you get from the reporting connection. The supported parameters are:
- startDateFrom
- startDateTo
- endDateFrom
- endDateTo
- dateMatch
- maxRows
These parameters help filter the data by date and limit the number of results.
This section isn’t ready just yet—we’re working on it! Please check back soon, and if you need help right away, feel free to ask in our Community Forum.
Updating Transformation Steps when Automation Data Changes
You only need to do this when adding new data. Removing data doesn't require these changes.
Also, check that the column mapping includes a label for the new data.
If you add a new input, output, or variable to the automation and there are already existing rows in the report data, the new column won’t appear. This is due to the transformation step to ‘Remove Other Columns’ using:
= Table.SelectColumns(#"Expanded Variable",Table.Column(columns, "ColumnId"), MissingField.Ignore)
To fix this, change the last argument to:
MissingField.UseNull
This will allow the new column to show up even in older rows.
Click the cog icon, and load more; this should show the new column, but will be unselected; select all and hit ok.
Adding transformation steps
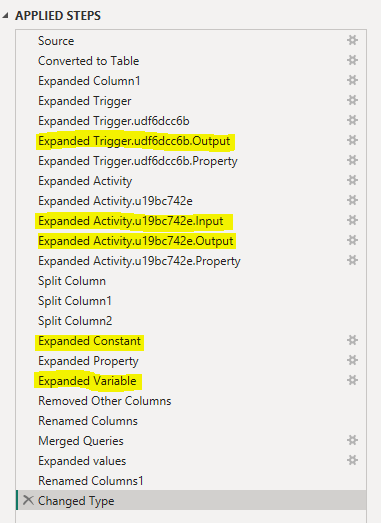
When you work with Power Query, you often add transformation steps like expanding or 'zipping' arrays. These steps appear in the Applied Steps view (see below).
Usually, you add new steps to the bottom of the list. Select the last step, then insert a new one, which adds it to the end. This method is safest because it minimizes the chance of breaking subsequent steps.
However, sometimes you may need to insert a step in the middle of the list. Be careful when doing this. If you encounter errors in the following steps, review and correct any affected steps.
Learn more from Microsoft about 'Applied steps' here