To manage reporting connectors, go to the Manage > Reporting Connectors.
A Reporting Connector connects an automation to Power BI or Excel. You need this connector to create a Power BI Dashboard, generate a Report, or extract data into Excel.
Creating reporting connectors
Click the "add" button in the toolbar ![]()

This will open up the New Reporting Connector dialog.

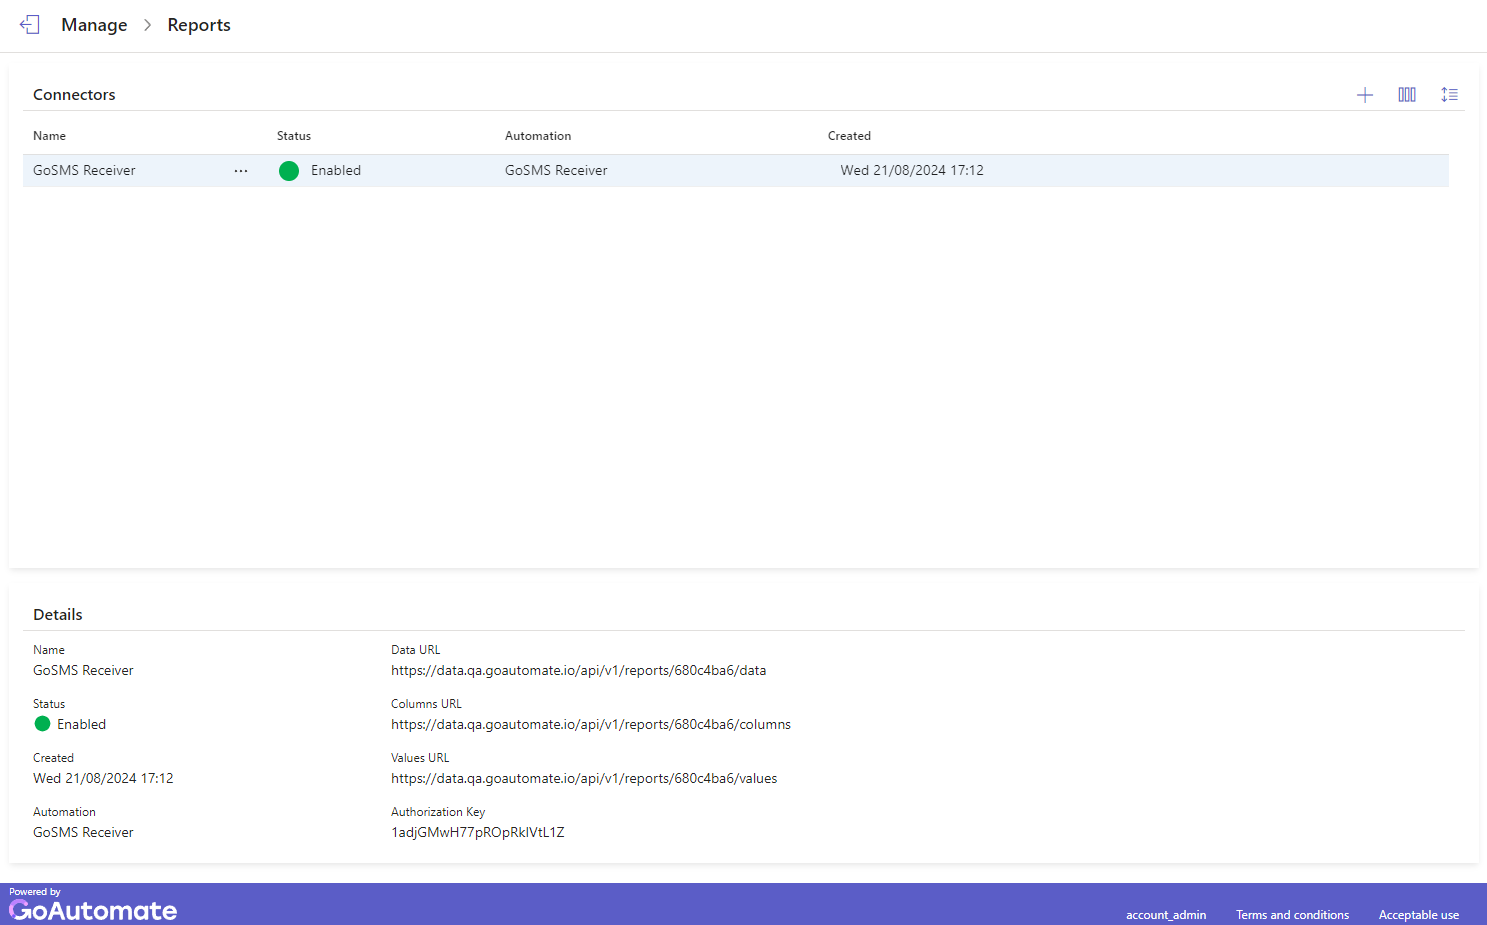
Search for your Automation. Add a Name and an optional Description, then click Save. You should see your new connector in the connectors table. Click the connector to view its details.
The connector is disabled by default. To enable it, click the "more" button next to connector Name ![]() and select the Enable option from the menu.
and select the Enable option from the menu.
Below are the columns in the Reporting Connectors table:
| Column | Description |
|---|---|
| Name | The connector's name. |
| Status | Indicates if the connector is Enabled or Disabled. |
| Automation | The automation linked to this connector. |
| Created | The date and time the connector was created. |
When you select a connector, the Details panel shows the following properties:
| Property | Description |
|---|---|
| Data URL | Use this URL to connect Power BI and Excel to the report data. |
| Columns URL | Use this URL to connect Power BI and Excel to the column labels. |
| Values URL | Use this URL to connect Power BI and Excel to the value substitutions. |
| Authorization Key | This key protects your report data from unauthorized access. |
You can easily customize the view using the toolbar, including selecting which columns to display and adjusting row spacing.
You can sort any column to organize the connectors as you prefer. You can also rearrange the columns by dragging them left or right.
Setting column mappings
To access Column Mappings, click the "more" button next to connector Name ![]() and select the Column Mappings option from the menu. You will then see the following panel:
and select the Column Mappings option from the menu. You will then see the following panel:
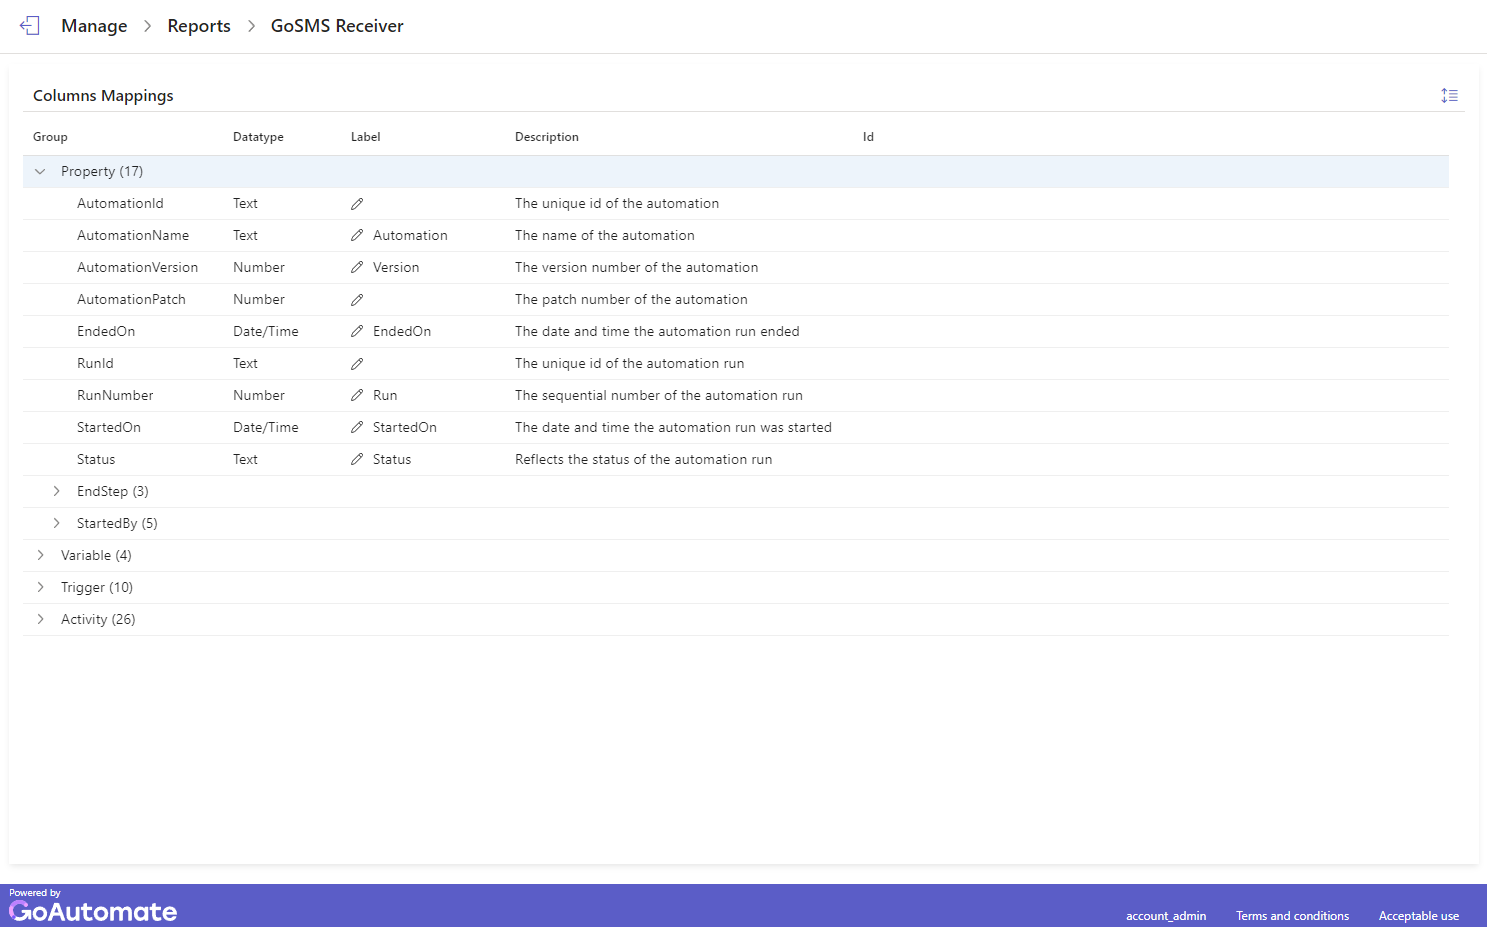
The report data is organized into groups. Expand each group to see its data items. If a data item has a Label, it will show up in the connector data. To add, edit or delete a Label, double-click the edit (pencil) icon.
Using the toolbar you can adjust row spacing. You can also rearrange the columns by dragging them left or right.
Here are the columns in the Column Mappings panel:
| Column | Description |
|---|---|
| Group | A name that organizes the data in the automation. |
| Datatype | The type of each data item. |
| Label | The name given to the data item. |
| Description | A brief explanation of the data item. |
| Id | An alphanumeric identifier for user-defined data. |
Setting value mappings
To access Value Mappings, click the "more" button next to connector Name ![]() and select the Value Mappings option from the menu. You will then see the following panel:
and select the Value Mappings option from the menu. You will then see the following panel:
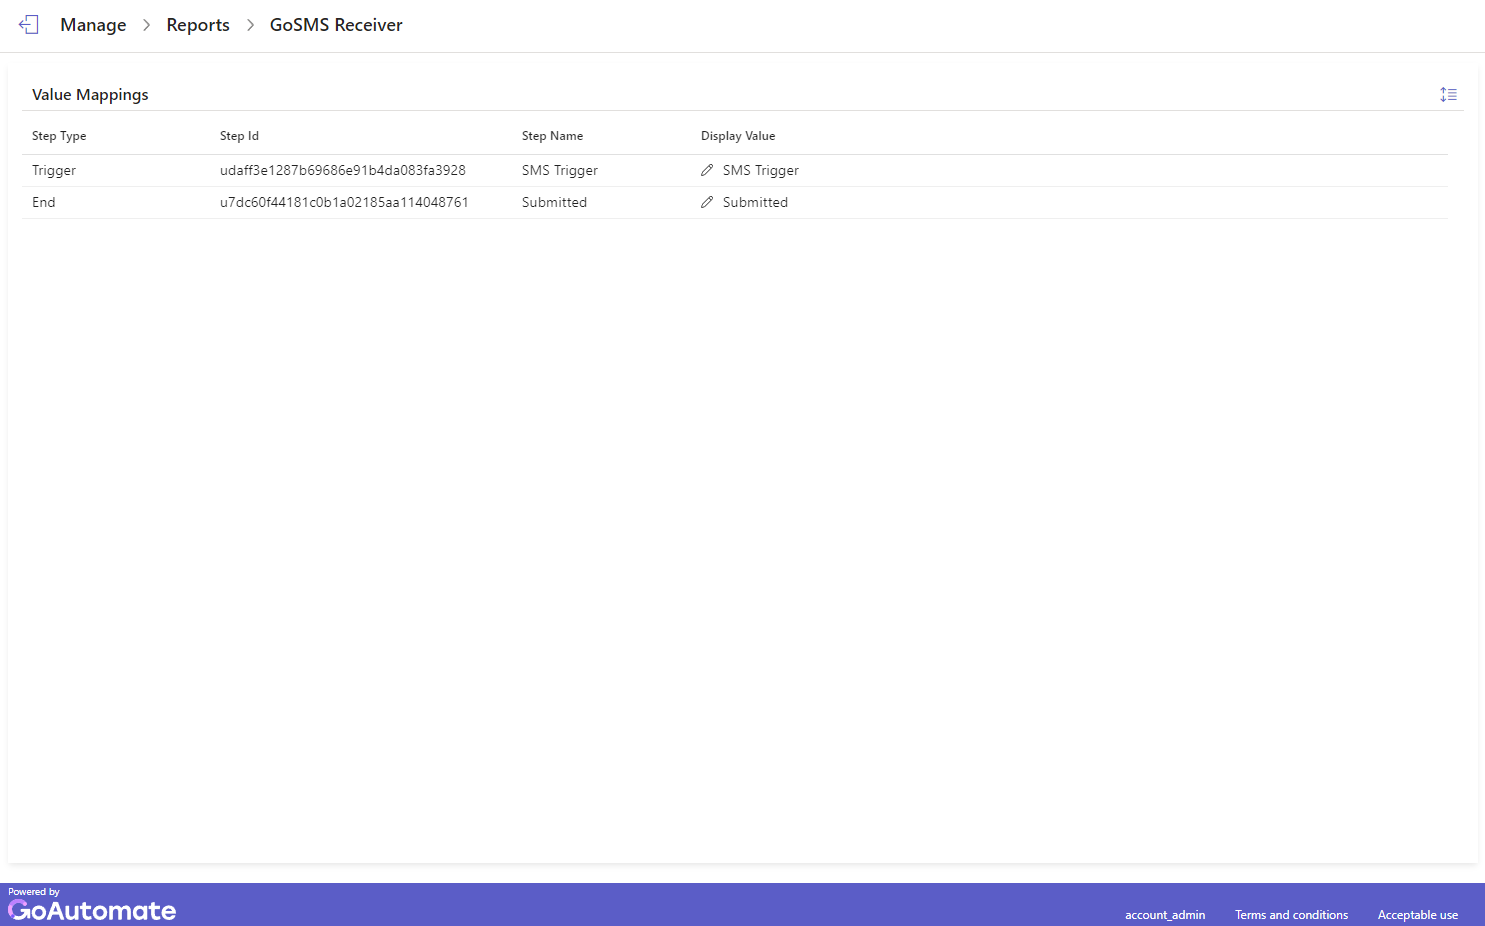
To add, edit or delete a Value, double-click the edit (pencil) icon.
Using the toolbar you can adjust row spacing. You can also rearrange the columns by dragging them left or right and sort any column to organize the items as you prefer.
Here are the columns in the Value Mappings panel:
| Column | Description |
|---|---|
| Step Type | Indicates whether the step is a Trigger or an End. |
| Step Id | A unique alphanumeric code for the step. |
| Step Name | The name given to the step in the automation. |
| Display Value | The name that will appear in reports or data extracts. |