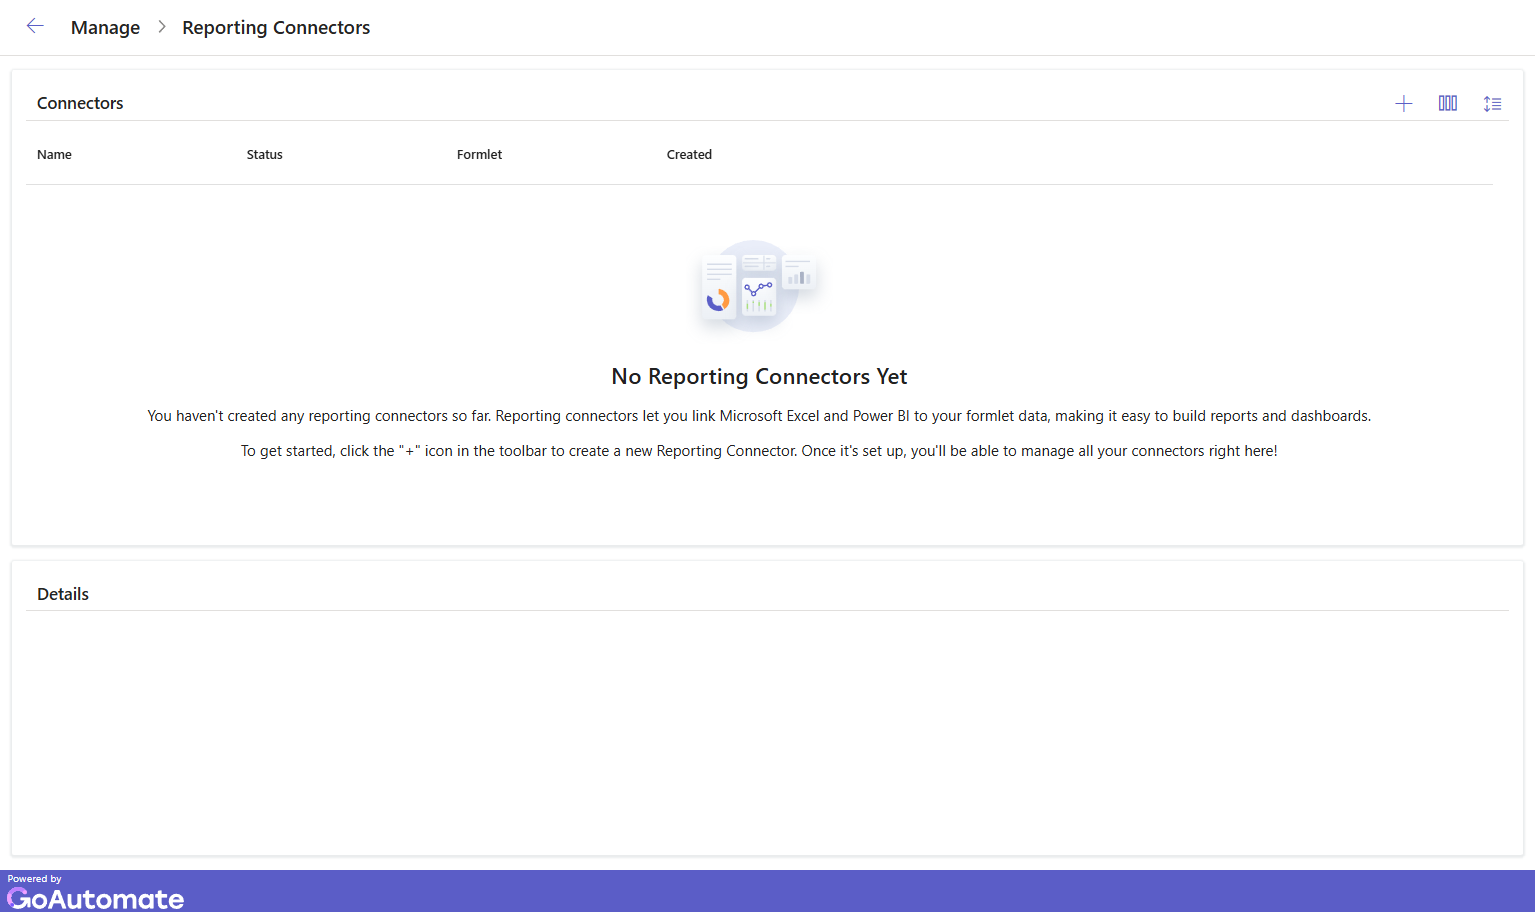
To manage reporting connectors, go to the Manage > Reporting Connectors.
A Reporting Connector connects an approval to Power BI or Excel. You need this connector to create a Power BI Dashboard, generate a Report, or extract data into Excel.
Creating reporting connectors
Click the "add" button in the toolbar ![]()
This will open up the New Reporting Connector dialog.
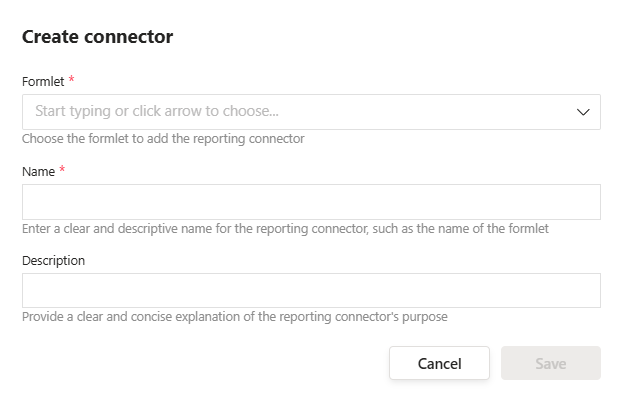
Search for your Approval. Add a Name and an optional Description, then click Save. You should see your new connector in the connectors table. Click the connector to view its details.
The connector is disabled by default. To enable it, click the "more" button next to connector Name ![]() and select the Enable option from the menu.
and select the Enable option from the menu.
Below are the columns in the Reporting Connectors table:
| Column | Description |
|---|---|
| Name | The connector's name. |
| Status | Indicates if the connector is Enabled or Disabled. |
| Approval | The approval linked to this connector. |
| Created | The date and time the connector was created. |
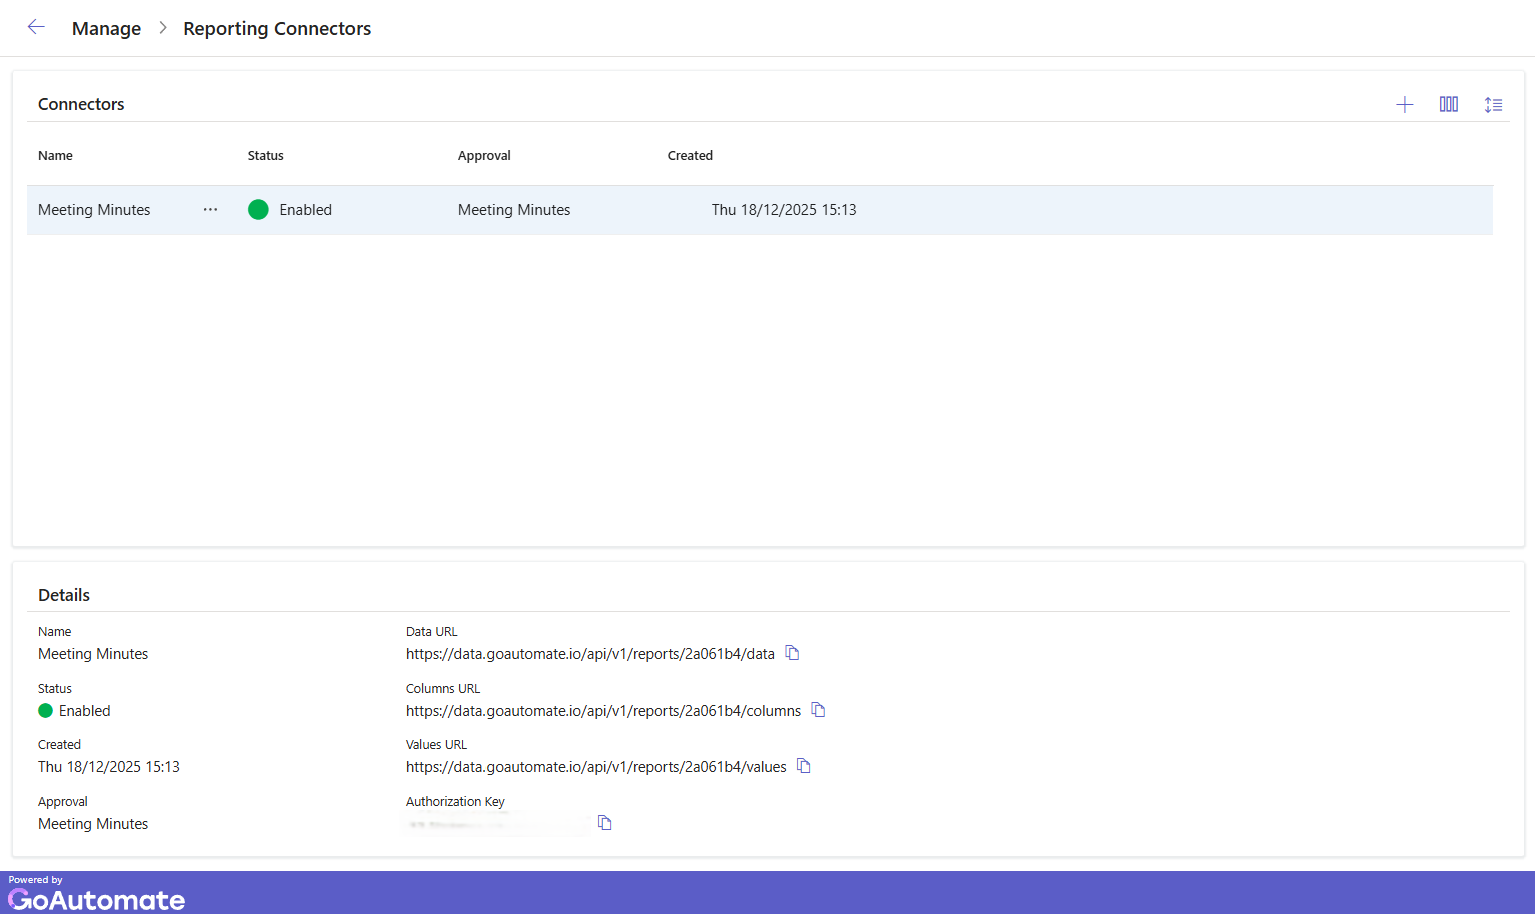
When you select a connector, the Details panel shows the following properties:
| Property | Description |
|---|---|
| Data URL | Use this URL to connect Power BI and Excel to the report data. |
| Columns URL | Use this URL to connect Power BI and Excel to the column labels. |
| Values URL | Use this URL to connect Power BI and Excel to the value substitutions. |
| Authorization Key | This key protects your report data from unauthorized access. |
You can easily customize the view using the toolbar, including selecting which columns to display and adjusting row spacing.
You can sort any column to organize the connectors as you prefer. You can also rearrange the columns by dragging them left or right.
Setting column mappings
To access Column Mappings, click the "more" button next to connector Name ![]() and select the Column Mappings option from the menu. You will then see the following panel:
and select the Column Mappings option from the menu. You will then see the following panel:
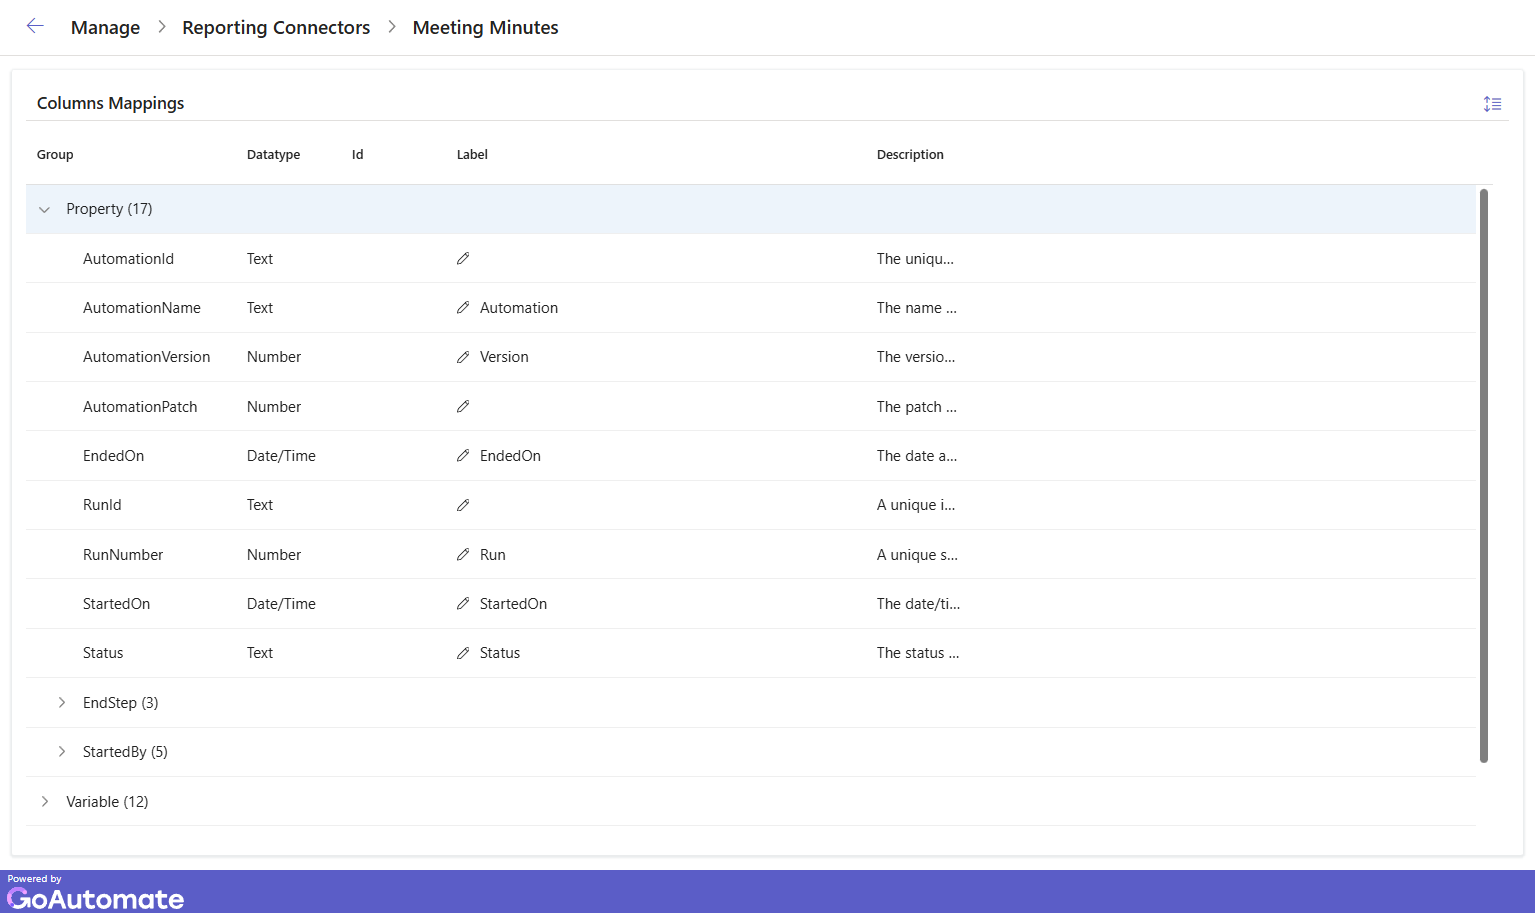
The report data is organized into groups. Expand each group to see its data items. If a data item has a Label, it will show up in the connector data. To add, edit or delete a Label, double-click the edit (pencil) icon.
Using the toolbar you can adjust row spacing. You can also rearrange the columns by dragging them left or right.
Here are the columns in the Column Mappings panel:
| Column | Description |
|---|---|
| Group | A name that organizes the data in the approval. |
| Datatype | The type of each data item. |
| Label | The name given to the data item. |
| Description | A brief explanation of the data item. |
| Id | An alphanumeric identifier for user-defined data. |
Setting value mappings
To access Value Mappings, click the "more" button next to connector Name ![]() and select the Value Mappings option from the menu. You will then see the following panel:
and select the Value Mappings option from the menu. You will then see the following panel:
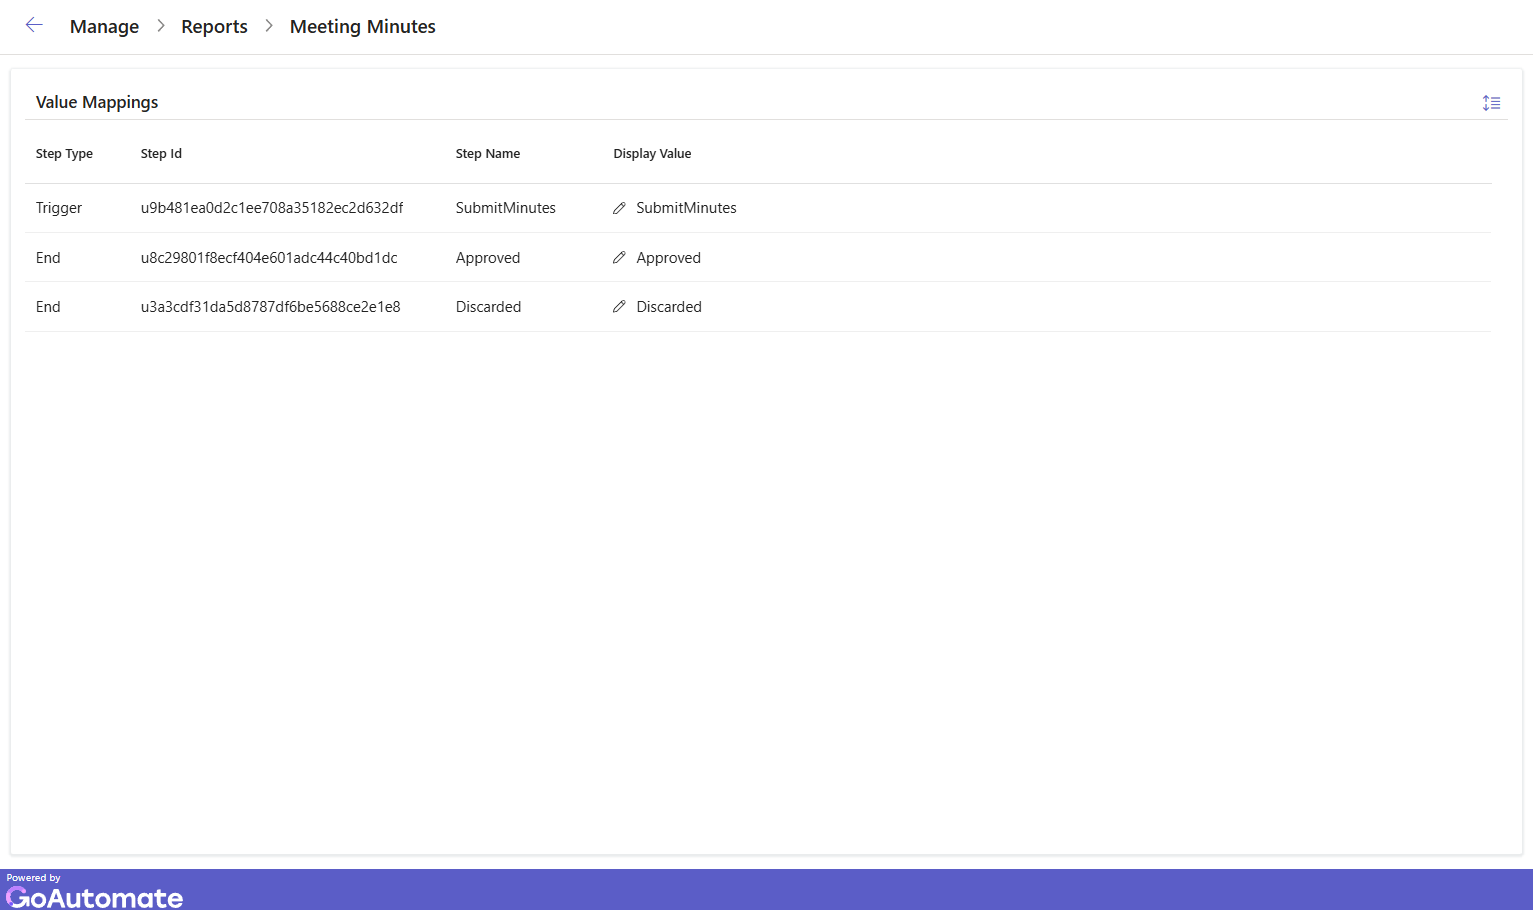
To add, edit or delete a Value, double-click the edit (pencil) icon.
Using the toolbar you can adjust row spacing. You can also rearrange the columns by dragging them left or right and sort any column to organize the items as you prefer.
Here are the columns in the Value Mappings panel:
| Column | Description |
|---|---|
| Step Type | Indicates whether the step is a Trigger or an End. |
| Step Id | A unique alphanumeric code for the step. |
| Step Name | The name given to the step in the approval. |
| Display Value | The name that will appear in reports or data extracts. |
Standard reporting data
This section lists all data available for every approval run. These data do not depend on what you add to steps in your approval. They are the standard data provided for each run.
Run data
The standard data associated with the approval run.
| Property | Description | Datatype |
|---|---|---|
| RunId | The unique id of the run | Text |
| RunNumber | The sequential number of the run | Number |
| AutomationId | The unique id of the automation | Text |
| AutomationName | The name of the automation | Text |
| AutomationVersion | The version number of the automation | Number |
| AutomationPatch | The patch number of the automation | Number |
| StartedOn | The date and time the run started | Datetime |
| StartedBy > Source > Id | The id of the source that triggered the run | Text |
| StartedBy > Source > Type | The type of the source that triggered the run | Text |
| StartedBy > Person > Id | The id of the person that triggered the run | Text |
| StartedBy > Person > Name | The name of the source that triggered the run | Text |
| Status | Reflects the status of the run, one of Running, Completed, Terminated, Errored or Failed | Text |
| EndedOn | The date and time the run ended | Datetime |
| EndStep > Id | The id of the end step that was reached | Text |
| EndStep > Colour | The colour of the end step | Text |
| EndStep > Score | The score of the end step | Number |
Trigger data
The standard data associated with the trigger that starts the approval run.
| Property | Description | Datatype |
|---|---|---|
| Id | The unique id of the trigger | Text |
| SubmittedOn | The date and time the trigger was submitted | Datetime |
| SubmittedBy > Source > Id | The id of the source from where the trigger was submitted | Text |
| SubmittedBy > Source > Type | The type of the source from where the trigger was submitted | Text |
| SubmittedBy > Person > Id | The id of the person who submitted the trigger | Text |
| SubmittedBy > Person > Name | The name of the person who submitted the trigger | Text |
Activity data
The standard data available for each activity in the approval run.
| Property | Description | Datatype |
|---|---|---|
| CreatedOn | The datetime when the activity was created | Datetime |
| OfferOn | The datetime when the activity became ready to start | Datetime |
| DueOn | The datetime when the activity is expected to complete | Datetime |
| ReportDue | The number of minutes before DueOn when the activity is marked as due | Number |
| ExpireOn | The datetime when the activity expires | Datetime |
| ReportExpire | The number of minutes before ExpireOn when the activity is marked as expiring | Number |
| MaxRetain | The maximum number of minutes a user may retain the activity | Number |
| Count | The number of times the activity has completed (for activities that loop back and repeat) | Number |
| Status | The status of the activity, one of Pending, Ready, Started, Completed, Cancelled, Expired, Errored or Withdrawn | Text |
| CompletedBy > IsMultiple | Indicates multiple people completed the activity | Logical |
| CompletedBy > Count | The number of people who completed the activity | Number |
| CompletedBy > Source > Id | The id of the source from where activity was completed | Text |
| CompletedBy > Source > Type | The type of the source from where activity was completed | Text |
| CompletedBy > Person > Id | The id of the person who completed the activity | Text |
| CompletedBy > Person > Name | The name of the person who completed the activity | Text |